
Table of Contents
An Instagram engagement rate calculator only helps if the formula stays the same. Instagram analytics feel objective because they are numbers. They are also easy to misread, because the same word – engagement, reach, growth – can mean different calculations in different tools, and because a number that describes the past is often sold as a prediction of the future. This article explains the formulas, the limits, and a testing method that does not require believing any single benchmark.
In short: Engagement rate is total interactions divided by a chosen base, times 100: 340 interactions on 10,000 followers is 3.4% by followers, but 6.2% by reach. State the base every time. Hashtags help discovery, not guaranteed growth, and the best posting time is when your own audience is active, tested in your account.
Engagement rate: two formulas, two different stories
Engagement by followers = (likes + comments + shares + saves) / followers x 100. Engagement by reach = (likes + comments + shares + saves) / reach x 100. The second is usually higher, because reach is usually smaller than followers for a given post, and because reach counts only people who actually saw the post.
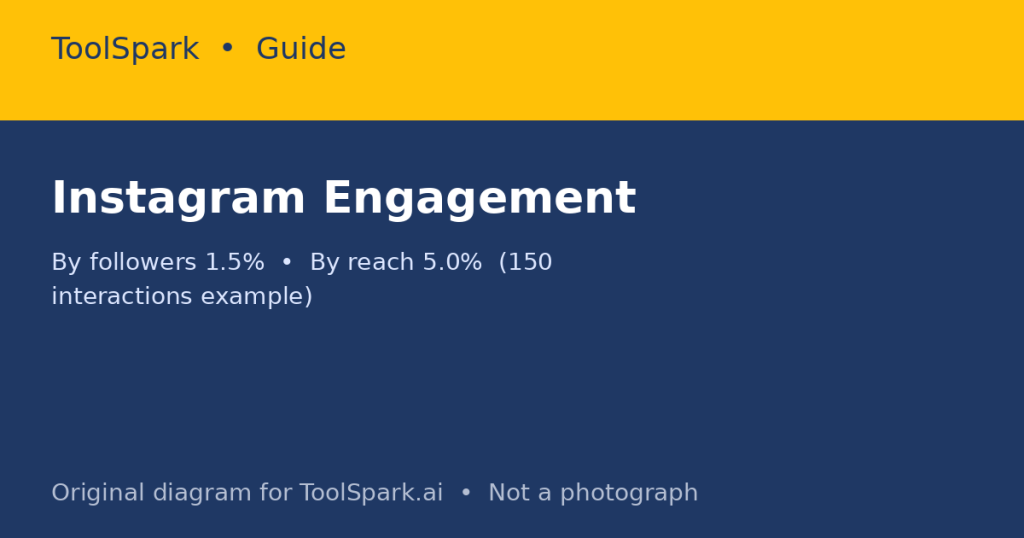
Worked example: a post gets 120 likes, 15 comments, 10 shares, and 5 saves – 150 interactions. On an account with 10,000 followers, engagement by followers is 1.5%. If the post reached 3,000 people, engagement by reach is 5.0%. Both numbers describe the same post. Quoting one without saying which denominator you used is misleading, even if unintentional. When you compare posts, use the same formula every time, and when you compare accounts, check that they used the same formula too.
Why engagement by reach is often more useful for a single post: it measures how people who actually saw the post responded, rather than penalising a post for followers who never saw it. Why engagement by followers is still useful: it measures how much of your total audience a post activated. Use both, label both, and do not switch denominators to make a post look better. Use the ToolSpark Instagram Engagement Rate Calculator and Instagram Reach Calculator with a consistent formula.
Hashtags: categorisation, not magic
Hashtags categorise content and help Instagram understand what a post is about, which can help it surface to people interested in that topic. They do not, by themselves, create demand for a post. A post that no one watches, saves, or shares will not be saved by adding 30 hashtags, and a post that people do watch and share can perform well with a few relevant tags.
A practical approach: use a small set of relevant tags – a mix of broad topic tags, niche tags specific to your subject, and, if you have one, a branded tag for your own series – rather than a large set of generic viral tags that do not describe the post. Check tags in the ToolSpark Hashtag Analyzer for relevance and competition, not just volume, and remove tags that attract the wrong audience: irrelevant reach that does not engage can make your engagement-by-reach rate look worse, not better. The ToolSpark Instagram Hashtag Generator can suggest relevant tags to check.
Posting times: your audience, not a global timetable
A ‘best time to post’ from a global study is an average across countries, niches, and audience ages. Your audience has its own pattern, visible in your own analytics under audience activity times. Use a global time as a hypothesis, post at that time for several weeks, and compare reach and early engagement with your previous pattern – controlling, as far as you can, for content type, because a Reel and a carousel are not comparable tests of timing alone.
Time zones matter here in a concrete way: if your audience is in another country, posting at 7 pm your time may be 2 am theirs. The ToolSpark Time Zone Converter helps you translate a posting time, but the decision should come from your audience data, not from a converter. Test windows with the ToolSpark Instagram Post Time Calculator.
What calculators can and cannot do
| Tool | Useful for | Not a promise of |
|---|---|---|
| Engagement Rate Calculator | Comparing your own posts with a consistent formula | Future reach or growth |
| Hashtag Generator / Analyzer | Finding relevant tags and checking competition | Discovery or virality |
| Post Time Calculator | Testing posting windows based on audience timezone | That a time will work for your niche |
| Reach Calculator | Understanding reach rate for a post | That reach will repeat |
| Money / Earnings Calculator | Scenario planning from assumed rates | Actual sponsorship income, which depends on negotiation, niche, audience quality, and brand fit |
Earnings and follower-growth projections deserve special caution: they extrapolate from current numbers and assumed rates that may not hold. A projection that assumes your follower count grows 10% a month for a year will look impressive and will almost certainly be wrong, because growth is rarely linear. Treat such tools as scenario planners, not forecasts, and be sceptical of any service that uses them to promise guaranteed followers, likes, or income. For captions, use the ToolSpark Instagram Caption Generator as a starting point, not as a guarantee.
A testing method you can actually run
- Pick one variable to test for a month: posting time, format, or hashtag set – not all three at once.
- Post consistently, at least several times, so one outlier does not decide the result.
- Record the same metrics for every post, with the same engagement formula, in a simple table.
- Compare averages, not single best posts, and note what else changed (a trending topic, a collaboration, a holiday).
- Keep what worked, discard what did not, and test the next variable. That loop – hypothesis, consistent test, labelled measurement – is the real value of these tools. The tools calculate; you decide, based on your own labelled data, not on a generic benchmark.
Frequently Asked Questions
How is Instagram engagement rate calculated?
Most commonly as (likes + comments + shares + saves) divided by followers, times 100, or divided by reach, times 100. The two versions give different numbers, so always say which denominator you used.
What is a good engagement rate?
There is no universal good rate: it varies by account size, niche, format, and whether the denominator is followers or reach. Compare your own rate over time and against similar accounts, not against a single benchmark quoted without context.
Do hashtags still matter?
Hashtags help categorise content and can help discovery, but they do not guarantee reach. Relevance, the quality of the post, and whether viewers watch, save, or share it matter more than hashtag count.
What is the best time to post?
The time your own audience is active, which you can see in your own analytics. A generic ‘best time’ from another country or niche is a starting hypothesis to test, not a rule.
Can a calculator predict growth or earnings?
No. Calculators that project followers, earnings, or sponsorship rates from current numbers are extrapolations from assumptions, not predictions. Treat them as scenarios, and do not buy services that promise guaranteed growth based on them.


Community Reviews & Discussion
Be the first in the community to share a tip, workflow suggestion, or review for this tool!